
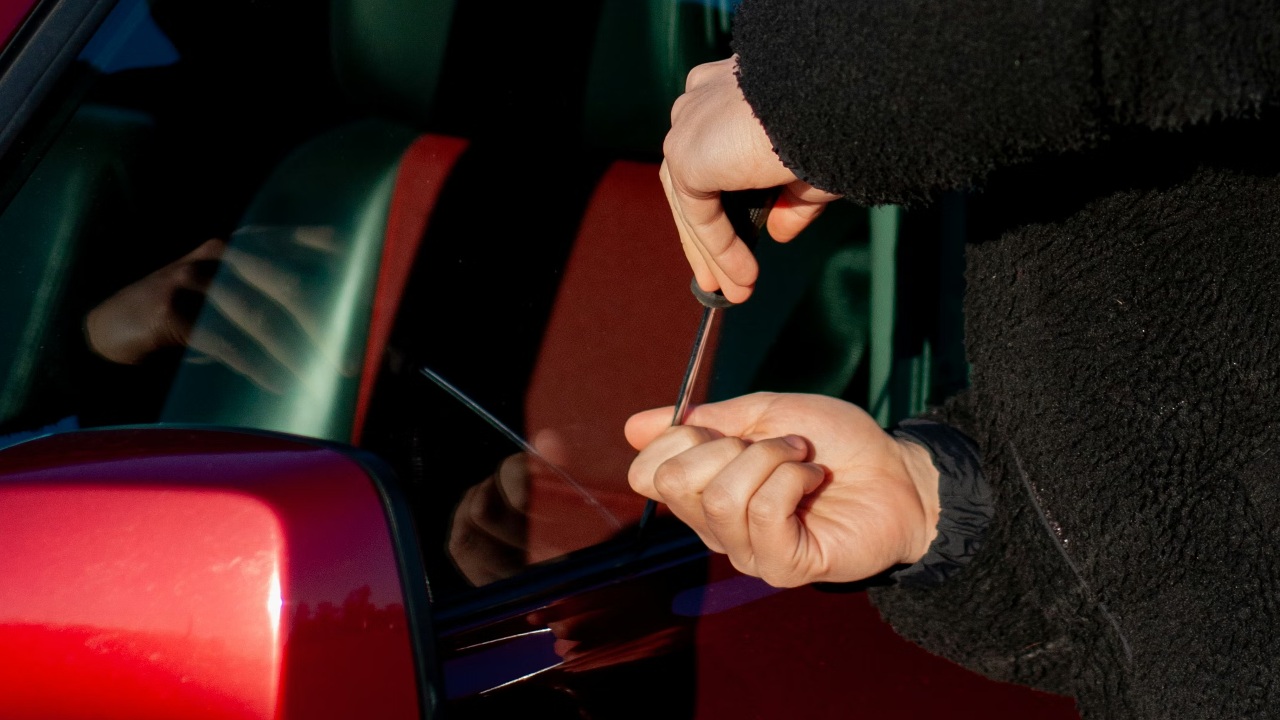
Car theft is easing off its pandemic peak, but the risk is far from evenly spread. Right now, a handful of states and the District of Columbia account for a disproportionate share of stolen vehicles, and the gap between the safest and riskiest places is widening.
I am looking at where the threat is highest, how those hot spots compare with the national trend, and what that means for drivers who park their cars in the wrong ZIP code at the wrong time.
The national picture: thefts are falling, but risk is concentrated
After a surge in stolen vehicles that crested in 2023, the overall trend is finally moving in the right direction. National data show that car theft is on the decline in the United States, with stolen vehicle figures now drifting back toward pre‑pandemic levels. One analysis of recent insurance and crime data notes that the national average theft rate dropped from 126.62 per 100,000 residents in the first half of 2024 to 97.33 per 100,000 in the first half of 2025, a sharp improvement that still leaves hundreds of thousands of drivers dealing with the fallout of a missing car.
That national average, however, hides how uneven the risk really is. The same data that show a broad decline also highlight a cluster of states where theft rates remain stubbornly high, even as the country overall improves. Industry researchers point out that car theft is still a major problem, and that some states, including California, continue to post some of the highest rates in the country despite the broader downturn. In other words, the United States is getting safer on paper, but where you live still matters more than the headline numbers suggest.
D.C. tops the list, with Western states close behind
Right now, the District of Columbia sits at the top of the national rankings for vehicle theft risk. Federal crime data compiled for the first half of 2025 show that the D.C. area recorded a theft rate of 373.09 per 100,000 residents, far above the national average of 97.33 per 100,000. That figure also places D.C. at the head of the Top 10 States with Highest Vehicle Theft Rate per 100,000 Residents, even though it is not a state in the traditional sense. For drivers who live or work in the city, that means the odds of walking back to an empty parking space are roughly four times higher than they are for the average American.
Several Western states are not far behind. California, which has long struggled with auto theft, continues to post some of the highest rates in the country according to recent car theft statistics that single out California by name. Other states that consistently appear near the top of current rankings include Nevada, New Mexico, Colorado, Missouri, Maryland, Texas, Alaska, and Washington, all of which are flagged in recent mapping of the states with the most car thefts in America. Together, these jurisdictions form a belt of elevated risk that stretches from the Pacific Coast through the Southwest and into parts of the Midwest and Mid‑Atlantic, even as the national average improves.
How the worst‑hit states compare with safer corners of the map
The spread between the riskiest and safest states is stark. At one end, the D.C. area’s 373.09 thefts per 100,000 residents towers over the national rate of 97.33 per 100,000 and the earlier 126.62 per 100,000 figure from 2024. At the other, states such as New Hampshire and Maine, which appear in recent state‑by‑state breakdowns but are not singled out for high theft rates, sit near the bottom of the rankings. That contrast means a driver who moves from Washington, D.C. to rural New England can see their statistical risk of car theft fall by a factor of several times without changing anything about how they drive or what they own.
Even among the high‑risk states, the picture is nuanced. California and Texas, for example, combine large populations with high theft rates, so they account for a significant share of total stolen vehicles nationwide. Smaller states like Nevada or New Mexico may have fewer thefts in absolute terms, but their per‑capita rates still place them among the most vulnerable. Mapping of the states with the most car thefts shows that Missouri, Maryland, Alaska, and Washington also punch above their weight on a per‑resident basis, reinforcing the idea that risk is not just about big cities or coastal hubs. For insurers, police departments, and drivers, that uneven geography shapes everything from premium pricing to where license plate readers and patrols are deployed.
What thieves are targeting and why some states are hit harder
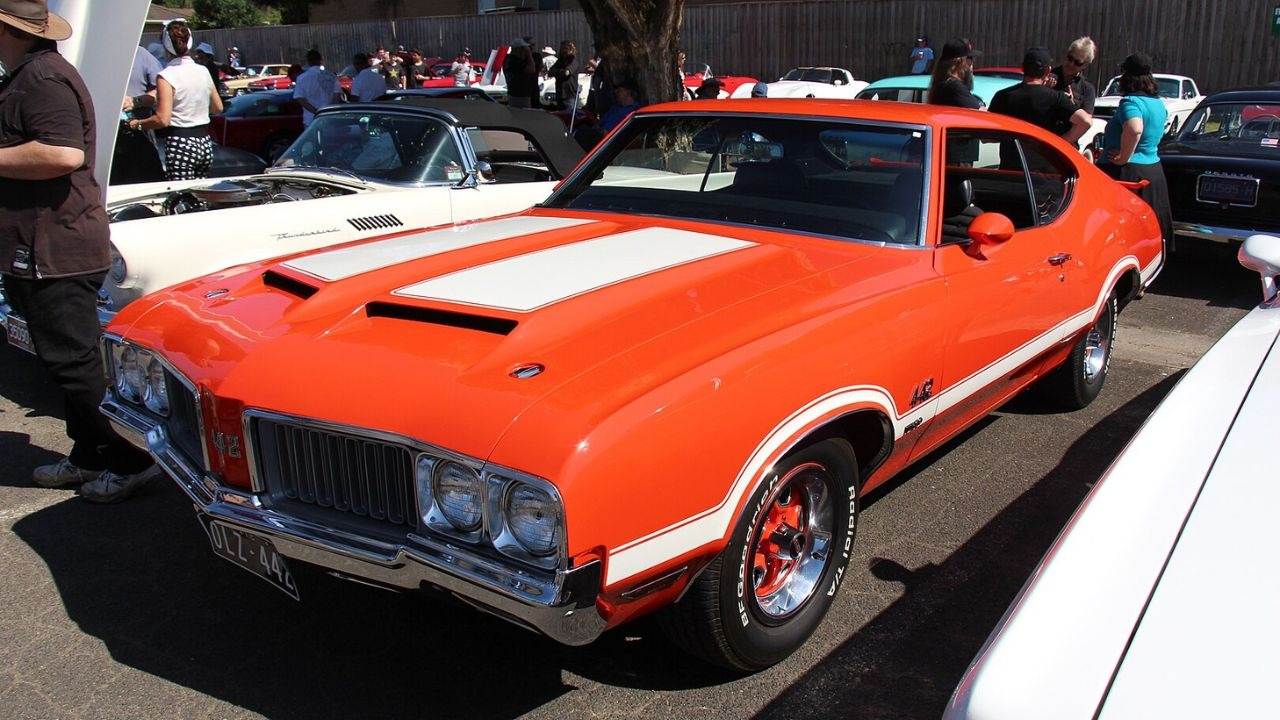
High‑risk states are not just losing more cars, they are also losing the same kinds of vehicles again and again. Recent insurance data on the most stolen cars in America show that familiar models such as older Honda Civics and Accords, full‑size pickup trucks like the Ford F‑150 and Chevrolet Silverado, and popular crossovers remain prime targets. Many of these vehicles lack modern immobilizers or have widely known vulnerabilities, which makes them easier to steal quickly in crowded urban areas or sprawling suburban parking lots. In states like California and Texas, where these models are especially common, the sheer number of attractive targets helps keep theft rates elevated.
Policy and enforcement differences also help explain why some states sit at the top of the risk table. Jurisdictions that have struggled with organized theft rings, limited police resources, or gaps in prosecution often see repeat offenders cycling through the system. The D.C. area’s leading rate of 373.09 per 100,000 residents, for example, reflects not only dense traffic and a high concentration of vehicles but also the challenges of coordinating enforcement across city and regional lines. Western states such as Nevada, New Mexico, Colorado, Alaska, and Washington, which appear prominently in recent theft maps, combine long highway corridors, busy tourist routes, and in some cases remote rural stretches where stolen vehicles can be moved or stripped before they are noticed.
How drivers in high‑risk states can respond
For drivers in the states topping the current risk rankings, the data are a warning, not a sentence. The same insurance analyses that track theft rates also highlight how basic steps can change the odds. Simple habits like always locking doors, avoiding idling with the engine running, and parking in well‑lit areas with cameras or steady foot traffic can make a difference, especially in places like D.C., California, or Texas where thieves have plenty of options. Adding visible deterrents such as steering wheel locks, aftermarket alarms, or GPS trackers can further reduce the appeal of a vehicle that might otherwise blend into a row of similar models.
Technology and insurance choices matter as well. Many newer cars offer smartphone‑based tracking through apps like myChevrolet, FordPass, or Hyundai’s Bluelink, which can help police locate a stolen vehicle more quickly in high‑theft corridors that run through Nevada, New Mexico, Colorado, Missouri, Maryland, Alaska, and Washington. Some insurers in these states also offer discounts for anti‑theft devices or telematics programs that monitor driving behavior, which can offset the higher premiums that often come with living in a hot spot. With the national theft rate falling from 126.62 to 97.33 per 100,000 residents, the states that stay at the top of the risk list are likely to see even more pressure from drivers and insurers to invest in prevention, because the rest of the country is proving that the trend can move in the right direction.